What if your company could predict problems before they occurred? Business Intelligence Reporting brings this possibility to life by converting raw data into usable and actionable information.
Most companies have plenty of data, yet find it very difficult to understand.
Business Intelligence Reporting makes this easy by creating visual dashboards, producing automated reports, and generating real-time alerts designed for spotting trends and tracking performance.
What is Business Intelligence Reporting?
Business Intelligence Reporting is all of your data collected in one place. Instead of having information scattered across sales tools, customer systems, and financial spreadsheets, BI pulls everything together in one place.
It turns raw numbers into clear reports and dashboards that show you what’s going on in your business, both right now and over time.
You can spot trends, keep track of your goals, and catch small issues before they turn into bigger problems.
Types of Business Intelligence Reports
Companies use different types of reports based on their needs and timing requirements.
Operational Reports track your business activities which can be sales numbers, inventory levels and customer service tickets.
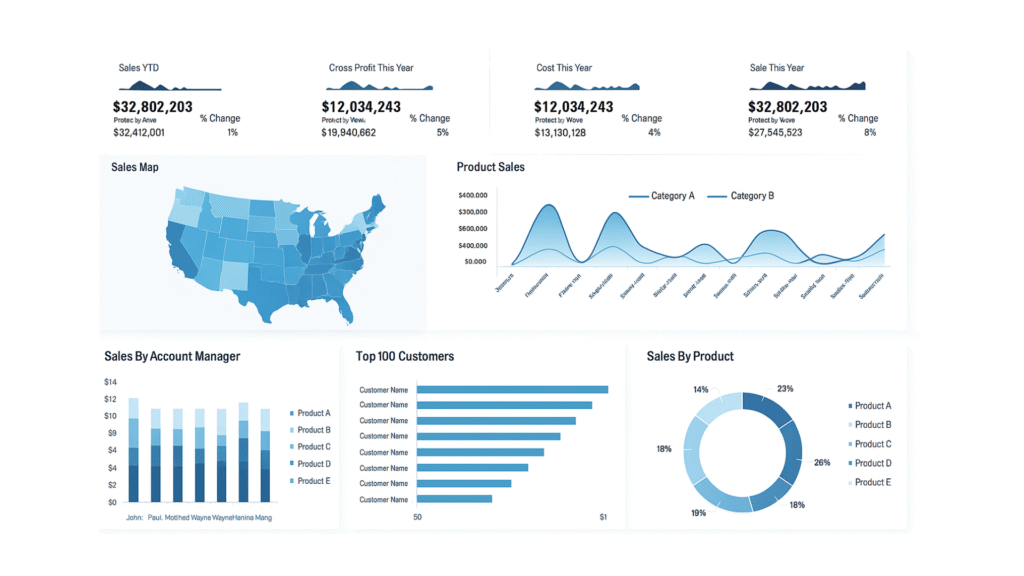
Analytical Reports are for strategic planning and trends over time. They show analytics, which can be: which products sell best during different seasons, which marketing campaigns deliver the highest ROI, etc.
Dashboard Reports give you overviews over key metrics all in one screen. They are best used if you’re an executive who needs to see and combine multiple data sources into visual summaries.
Compliance Reports help you to meet regulatory requirements and internal policies. These might track employee training completion, financial controls, or quality standards.
Real Examples of BI Reporting in Action
This is a way to show how businesses are using business intelligence reporting, depending on their industry:
- Retail Store Chain:
Their BI dashboard shows which products sell best in each location, when to reorder inventory, and which stores perform above or below average.
- Manufacturing Company:
Their reports track production line efficiency, quality defects, and equipment maintenance schedules and predict when machines need repairs before they break down.
- Healthcare Provider:
Their system tracks patient wait times, doctor availability, and treatment outcomes. They can spot staffing shortages before they affect patient care.

Why Your Business Needs BI Reporting
Companies without proper reporting often make decisions based on gut feeling or outdated information. This leads to missed opportunities and costly mistakes.
BI reporting changes this by giving you facts instead of guesses. You can see which products make money, which customers are most valuable, and where you’re wasting resources.
Measurable Business Benefits
Organizations that implement BI reporting see real results:
Benefit | Average Improvement | Timeline |
| Decision Speed | 5x faster | 3-6 months |
| Data Accuracy | 25% fewer errors | 2-4 months |
| Cost Reduction | 15-20% savings | 6-12 months |
| Revenue Growth | 10-15% increase | 12-18 months |

If you want to learn more about how BI creates value and understand the specific advantages for your industry, you can read about benefits of business intelligence for small businesses here.
Essential Features of Modern BI Reporting
Today’s business intelligence reporting tools offer advanced features that make data analysis easier and more powerful.
| Feature | What It Does | Business Impact |
| Real-time Data Processing | Reports update as soon as new data comes in | Critical for fast-moving businesses like retail or manufacturing |
| Self-Service Capabilities | Business users create reports without IT help | Reduces bottlenecks, empowers teams to find answers quickly |
| Mobile Access | Check metrics from anywhere, anytime | Sales managers review numbers during commute, check inventory from warehouse |
| Automated Alerts | System sends notifications when metrics hit targets | Catch problems early, never miss important changes |
| Interactive Dashboards | Click and drill down into details instantly | Investigate issues quickly, explore data deeper |
Choosing the Right Business Intelligence Reporting Platform
Picking the wrong BI tool costs time and money. The right choice depends on your company size, technical skills, and budget.
Cloud-based platforms work well for most businesses because they’re quick to set up and don’t require special hardware. You pay monthly and can scale up or down as needed.
On-premise solutions give you more control but require IT expertise to maintain. They’re better for companies with strict security requirements or unique data needs.
Platform Comparison
Platform Type | Setup Time | Monthly Cost | Best For |
Cloud-based | 1-4 weeks | $25-200 per user | Small to medium businesses |
On-premise | 3-6 months | High upfront cost | Large enterprises |
Hybrid | 2-8 weeks | Variable | Companies with mixed needs |
Corpim specializes in helping businesses implement business intelligence reporting solutions that deliver real results.
Building Effective Business Intelligence Reports
Good reports tell a story with data. They highlight what’s important and make it easy to take action.
Visual Design matters more than you might think. Clean, simple charts are easier to understand than complex ones with too many colors or details.
Report Structure should follow a logical flow. Start with high-level summaries, then provide details for people who want to dig deeper.
Report Design Best Practices
Element | Best Practice | Common Mistake |
Charts | Use appropriate chart types | Using pie charts for everything |
Colors | Limit to 3-4 colors | Rainbow charts |
Text | Keep labels short | Long, technical descriptions |
Layout | Group related information | Random placement |
Filters | Make them obvious | Hidden or confusing controls |
Data Integration Strategies
Most companies have data in multiple systems. BI reporting works best when you bring this data together properly.
Real-time Integration connects directly to source systems and updates reports immediately. This works well for operational data like sales or inventory.
Batch Processing collects data at scheduled times, like every night or every hour. This approach uses fewer system resources and works well for analytical reports.
If you want to learn more about different integration approaches and understand how cloud platforms handle data connectivity, you can read about hybrid cloud computing here.
Advanced BI Reporting Techniques
Basic reports show what happened. Advanced techniques help predict what will happen next and suggest actions to take.
Predictive Analytics uses historical data to forecast future trends. You can predict which customers might cancel subscriptions or which products will sell well next quarter.
Automated Insights use artificial intelligence to find patterns humans might miss. The system can alert you when numbers are unusually high or low compared to normal patterns.
Common Implementation Mistakes
Many business intelligence reporting projects fail because of predictable mistakes. Here are the biggest ones to avoid:
| Mistake | Why It Happens | How to Avoid It |
| Trying to Do Everything at Once | Teams want to solve all problems immediately | Start with most important reports, add features gradually |
| Ignoring Data Quality | Rush to build reports without cleaning data first | Spend time validating data before creating reports |
| Skipping User Training | Assume people will figure out the new system | Plan proper training from day one, provide ongoing support |
| No Executive Support | Leadership doesn’t actively promote the system | Get clear commitment from executives before starting |
| Poor Change Management | Don’t address user resistance to new tools | Communicate benefits clearly, involve users in design process |

Measuring Success
You need to track whether your BI reporting investment pays off. Set clear goals before you start and measure progress regularly.
Usage Metrics show how much people actually use the reports. High usage usually means the reports provide value, while low usage suggests problems.
Decision Impact measures how reports affect business outcomes. Track whether decisions made with BI data lead to better results than decisions made without it.
| Success Metric | Target | How to Measure |
User Adoption | 70-90% of intended users | Monthly active users |
Report Performance | Under 5 seconds load time | System monitoring |
Data Accuracy | Above 95% | Quality audits |
ROI | 200-400% within 2 years | Cost vs. benefits analysis |
If you want to learn more about comprehensive business intelligence strategies and understand how to build a complete BI program, you can read about business intelligence strategy here.
Key Takeaways
Business Intelligence Reporting transforms raw data into actionable insights that drive better decisions.
Start with clear business objectives and focus on solving specific problems rather than trying to do everything at once. Invest in data quality and user training to ensure adoption and accuracy.
Modern BI platforms offer powerful capabilities including real-time analytics, predictive insights, and self-service reporting.
For nearly 30 years, Corpim has been the trusted leader in digital transformation and data modernization services.
From Fortune 500 companies to growing startups across automotive, financial services, healthcare, and manufacturing industries, we deliver cloud computing solutions, enterprise performance management, and industry-specific SaaS products that drive real results.
Our certified professionals simplify complex business processes with modern DataTech services and scalable cloud solutions tailored to your needs.
Join thousands of satisfied clients who trust Corpim to modernize their IT infrastructure and leverage data for competitive advantage. Contact us today to discover how our integrated BI and analytics solutions can transform your business.


