_Article summary: Customer churn prediction uses historical and behavioral data to estimate which customers will stop buying or subscribing, and when. This guide covers how the models work, which algorithms fit different data profiles, how accurate the results can be, and how enterprises connect churn scores to forecasting, EPM, and BI systems to protect recurring revenue._
Retention is a data problem before it is a marketing problem. When an enterprise loses a customer, the signal was usually sitting in the data weeks earlier, a drop in usage, a support ticket left open, a failed payment. Customer churn prediction turns those scattered signals into a forward-looking risk score, so retention teams can act while the relationship is still recoverable. For organizations already running cloud analytics and enterprise reporting, it is one of the highest-return uses of data they already own.
What Is Customer Churn Prediction?
Customer churn prediction uses historical, transactional, and behavioral data to estimate the probability that a given customer will leave within a defined window. A model reviews patterns from customers who already left, learns what preceded their departure, then scores active customers against those patterns.
Two ideas often get blurred here. Churn rate is backward-looking, it tells you how many customers you lost last quarter. Churn prediction is forward-looking, it estimates who is likely to leave next. One measures the wound; the other helps you prevent it.
The raw material is data you probably already collect: purchase history, product usage, contract terms, support interactions, and demographics. Analytics estimates future customer behavior by reading those past interactions, one reason the line between reporting and prediction matters, a distinction we unpack in our breakdown of business intelligence versus data analytics. Reporting tells you what happened; predictive analytics tells you what is likely to happen next.
Churn is driven by identifiable, measurable factors rather than random attrition. A study from Iowa State University on the factors affecting customer churn using machine learning found that variables such as contract type, tenure, and service usage carry strong predictive weight, meaning the data most enterprises already hold is enough to build a credible first model.
My company has recently seen a slight uptick in customer churn that we’re having trouble tracking. We have a bit of seasonality in our business which …
Voluntary vs. Involuntary Churn
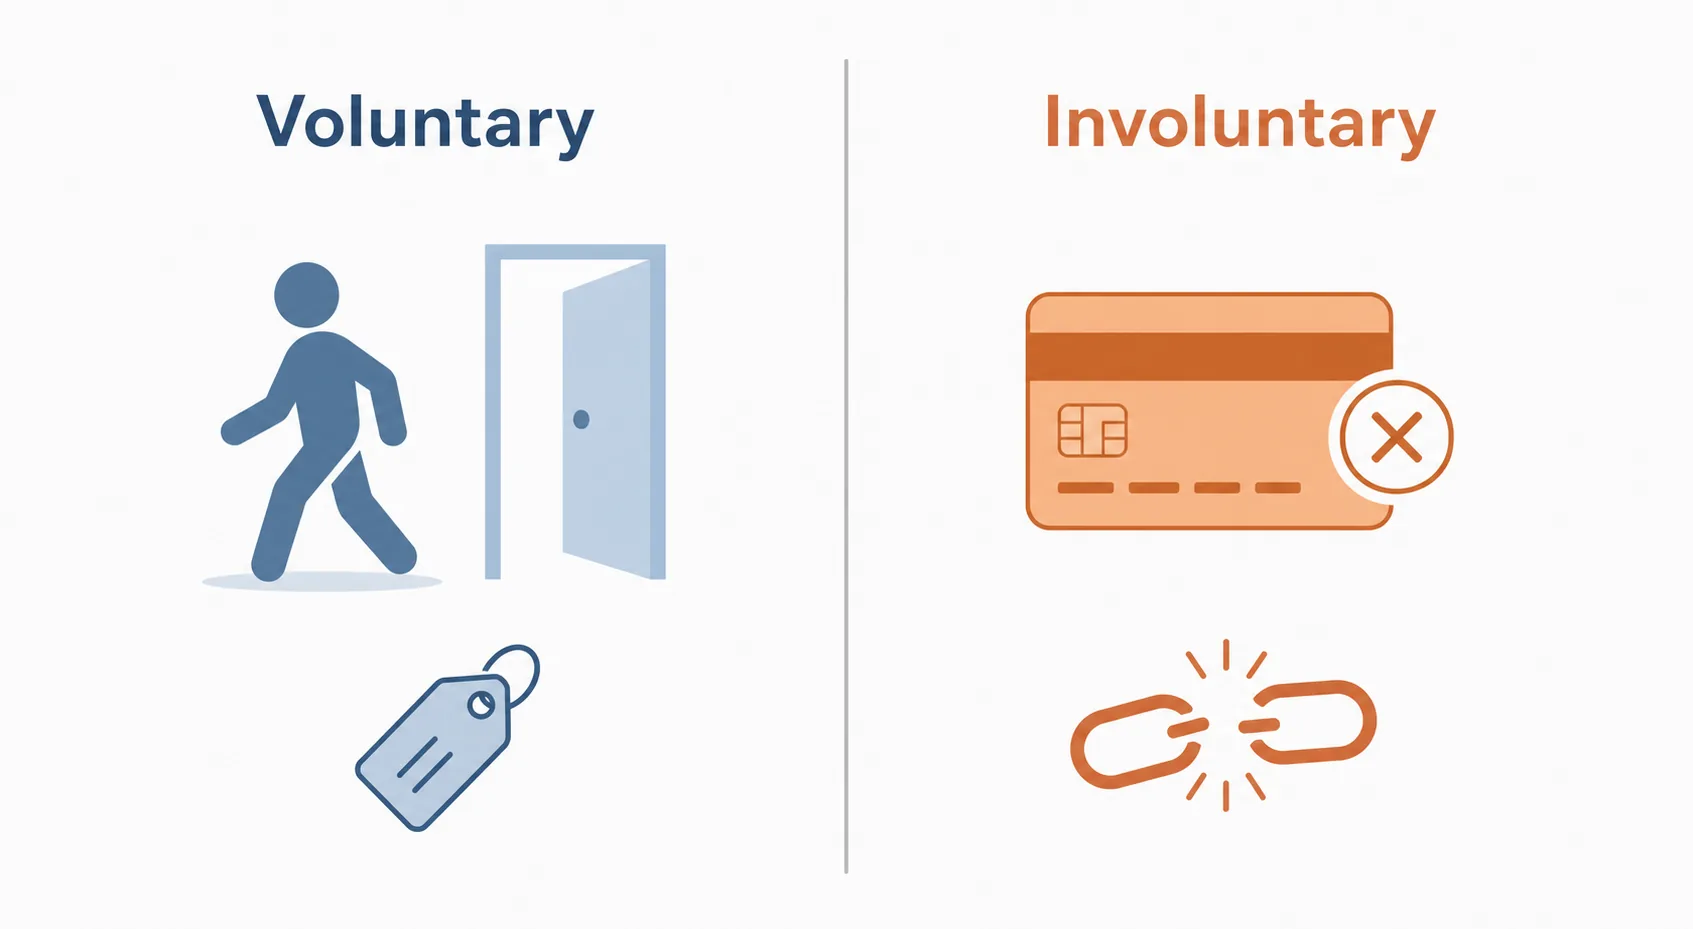
Not all churn is a decision. Voluntary churn happens when a customer actively chooses to leave, a better price elsewhere, a poor experience, or a product that no longer fits. Involuntary churn happens without intent: an expired card, a failed renewal, a billing integration that dropped a transaction.
The distinction matters because involuntary churn is frequently a data and integration problem, not a loyalty problem. When a payment system and a CRM fall out of sync, customers who wanted to stay get flagged as lost. A model that separates the two types tells you where to send a retention offer and where to fix a broken data pipeline.
Why Churn Prediction Matters to the Bottom Line
Keeping an existing customer generally costs far less than acquiring a new one. A modest reduction in churn compounds across a subscriber base, and because retained customers tend to spend more over time, the revenue effect outpaces the effort involved.
Churn prediction connects directly to customer lifetime value (CLV) and revenue forecasting. If you can estimate who is likely to leave, you can estimate revenue at risk, and that number belongs in board-level reporting, not just a marketing dashboard.
This is where prediction crosses into enterprise finance. A reliable churn signal feeds enterprise performance management (EPM) and financial forecasting, sharpening projections that would otherwise assume stable retention. Instead of forecasting revenue on last year’s averages, finance teams can adjust for the customers a model flags as high-risk this quarter.
How to Calculate Churn Rate (Foundation Before Prediction)
Before you predict churn, you have to measure it. The basic formula:
Churn rate = (customers lost during a period ÷ customers at the start of that period) × 100.
Begin a quarter with 2,000 customers and lose 100, and your quarterly churn rate is 5%. That single number is the baseline every prediction model is judged against.
Two refinements matter for enterprises. Customer churn counts logos lost; revenue churn counts dollars lost, and the two can diverge sharply when a few large accounts leave. Measuring both keeps a handful of enterprise departures from hiding inside a healthy-looking customer count.
To forecast churn rate, apply predicted per-customer churn probabilities across your active base and roll them up by cohort: group customers by signup date or contract term, then project expected losses for each group over the coming period. Cohort framing exposes whether newer customers churn faster than tenured ones, which shapes both the forecast and the fix.
How Customer Churn Prediction Models Work
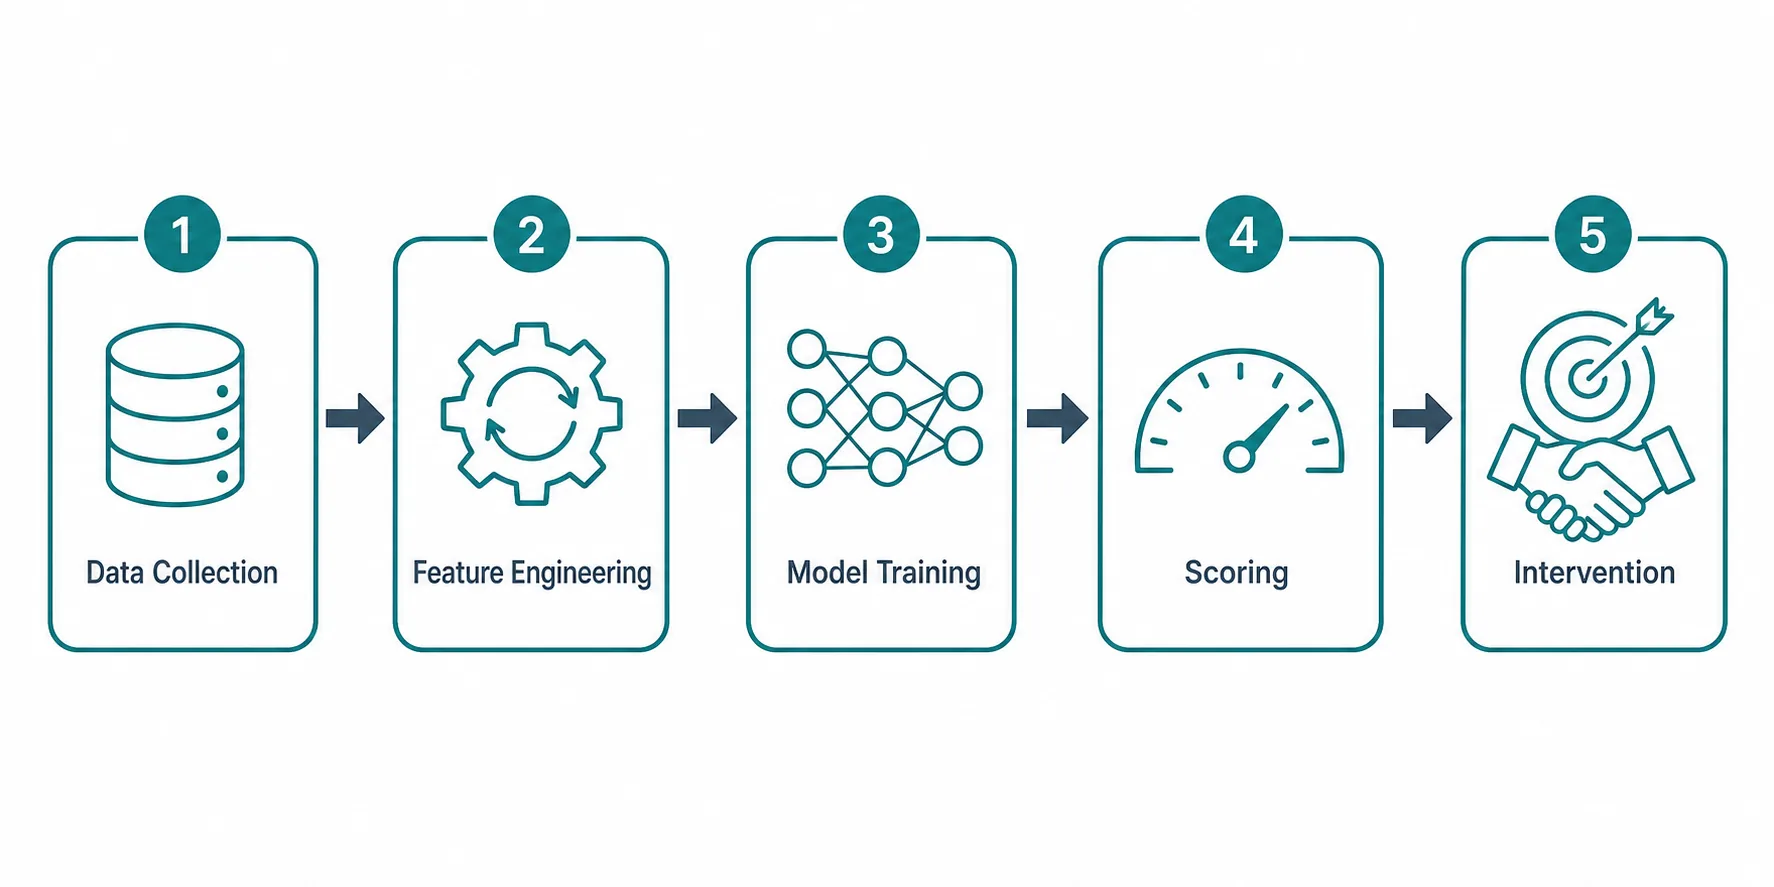
Most churn prediction efforts follow the same workflow, regardless of industry:
- Data collection, pull historical customer records, usage logs, transactions, and support history into one place.
- Feature engineering, transform raw data into signals a model can read (for example, “percent change in logins over 30 days”).
- Model training, feed labeled examples of churned and retained customers so the algorithm learns the patterns.
- Scoring, apply the trained model to active customers, producing a churn probability for each.
- Intervention, route high-risk customers to retention teams and measure whether outreach changes the outcome.
Step five is the one enterprises most often skip, and the one that turns a data-science exercise into revenue. A study of customer churn prediction in the telecom sector using machine learning walks the full arc, data preparation, model selection, evaluation, and shows how performance shifts with the quality of feature engineering rather than the choice of algorithm alone.
Data and Features That Signal Churn
The strongest predictors tend to be behavioral rather than demographic. Common high-value features:
- Usage frequency and trend, declining engagement is often the earliest warning.
- Support tickets, volume, sentiment, and unresolved issues.
- Contract type and tenure, month-to-month customers churn differently than annual ones.
- Payment history, late or failed payments flag both intent and integration issues.
- Product breadth, customers using more features tend to stay longer.
These signals rarely live in one system. Usage sits in the product, payments in an ERP, interactions in a CRM, transactions in a POS. Pulling them together across POS, ERP, and CRM sources is where cross-system data integration earns its keep, a model is only as complete as the customer view feeding it.
Best Models for Customer Churn Prediction
There is no single best model to predict customer churn. The right choice depends on your data volume, the need for interpretability, and how the output will be used. A model a compliance team must explain to auditors has different requirements than one scoring millions of records nightly.
| Model | Strengths | Interpretability | Best when |
|---|---|---|---|
| Logistic Regression | Fast, stable, well understood | High | You need a transparent baseline and clear feature weights |
| Decision Trees | Captures simple rules, easy to visualize | High | Stakeholders want to see the decision logic |
| Random Forest | Handles many features, resists overfitting | Medium | You have mixed, noisy data and want accuracy over transparency |
| Gradient Boosting (XGBoost) | Strong predictive performance on tabular data | Medium-Low | Accuracy is the priority and you can invest in tuning |
| Neural Networks | Learns complex, non-linear patterns | Low | Data is very large and interpretability is secondary |
Many enterprises start with logistic regression as a baseline, then move to gradient boosting once they trust their data pipeline. Interpretability is not a nice-to-have: research on customer churn prediction and model interpretability argues that a model retention teams can understand and trust is more likely to be acted on than a marginally more accurate black box no one questions.
I work for a high churn subscription business. Based on various iterations of ad-hoc churn analysis, I have a decent baseline understanding of …
How Accurate Is Customer Churn Prediction?
Accuracy is a misleading headline number for churn. Because churn is usually imbalanced, most customers stay, a model that predicts “no one will churn” can score 95% accuracy while catching zero of the customers you actually needed to save.
Better measures:
- Precision, of the customers flagged as high-risk, how many actually churned.
- Recall, of the customers who churned, how many the model caught.
- F1 score, the balance between precision and recall.
- AUC, how well the model separates churners from non-churners across all thresholds.
Real-world models trade precision against recall depending on the cost of action. If a retention offer is cheap, you tolerate false positives to catch more churners. If it is expensive, you tighten precision.
One principle holds across every deployment: accuracy depends far more on data quality and freshness than on algorithm choice. A well-tuned model fed stale, fragmented data will lose to a simple model fed clean, current, well-integrated data every time.
From Prediction to Forecasting: Churn in the Enterprise Data Stack
A churn score is a snapshot. The enterprise value comes from turning that snapshot into a moving picture, where churn prediction meets AI forecasting.
AI forecasting extends static churn scores into rolling risk forecasts. Instead of scoring customers once a month, real-time data pipelines let the model update risk continuously as behavior changes. That is essentially how AI predicts trends: it detects shifts in the patterns that precede an outcome and adjusts its estimate before the outcome arrives. Applied to retention, it turns “this customer is at risk” into “revenue at risk is trending up 4% this quarter, concentrated in these cohorts.”
From a data architecture standpoint, the payoff depends on where the output lands. A churn score buried in a data-science notebook changes nothing. The same score piped into BI dashboards, EPM systems, and analytics automation reaches the people who act on it, finance, retention, and account management. That requires solid data integration, API connectivity between systems, and often some legacy system modernization so older POS and ERP platforms can feed the model.
It is also where enterprise performance management software earns evaluation on integrations, scalability, and implementation. A churn forecast is only useful at the speed and volume your EPM platform can ingest, and only trustworthy if the integration keeps the numbers consistent across every dashboard that shows them.
Building a Churn Prediction Capability: Practical Path for Enterprises
A durable churn capability follows a sequence, and skipping steps is why many projects stall:
- Consolidate customer data. Break the silos between POS, ERP, CRM, and product systems so one customer has one record.
- Establish data governance and quality. Define ownership, fix duplicates, and set freshness standards, the model inherits every flaw in the source data.
- Choose a model that matches your needs. Start with an interpretable baseline; add complexity only when it earns its keep.
- Deploy scoring into production. Schedule regular scoring and retraining so the model tracks changing behavior.
- Close the loop. Route scores to retention teams and measure whether interventions change outcomes.
Teams building in-house have a mature open-source ecosystem to draw on. Python libraries such as scikit-learn and XGBoost cover most churn modeling needs, and public customer churn prediction Python notebooks and GitHub repositories offer reference implementations for feature engineering and evaluation. These lower the barrier to a first prototype, though production deployment still demands the data integration and governance work above.
That integration layer is where much of the difficulty concentrates. Connecting siloed operational data into cloud analytics, moving fragmented on-premise systems into a connected, AI/ML-ready environment, is a discipline in its own right, and one where deep enterprise data experience tends to separate models that ship from models that stall.
Common Pitfalls (Data Silos, Stale Data, No Action Loop)
Most churn models fail in production for predictable reasons. Data silos leave the model blind to half of each customer’s behavior. Stale data, a model trained once and never retrained, drifts as customer patterns shift. And the most common failure: no action loop.
A prediction that never reaches a retention team is a report, not a capability.
Fixing these three issues usually improves outcomes more than swapping in a fancier algorithm.
Frequently asked questions
What is the best model to predict customer churn?
How accurate is customer churn prediction?
How do you forecast churn rate?
Can AI predict customer trends and churn in real time?
Do you need Python to build a churn model?
The Takeaway
Customer churn prediction is often framed as a modeling exercise, but for enterprises it is really a data-integration and modernization outcome. The algorithm is the easy part; the value comes from unifying siloed customer data, keeping it fresh, and pushing predictions into the BI and EPM systems where retention decisions actually get made. Organizations that treat churn as a connected-data challenge, the kind of work a digital transformation partner like Corpim supports across industries, tend to turn retention signals into revenue, rather than into reports no one reads.