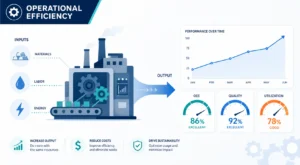
Operational efficiency metrics are quantifiable measures of the output a business produces relative to the resources it consumes. This guide defines the core metrics, gives you the formulas behind them, shares a reusable template structure, and shows how AI forecasting and enterprise performance management keep those numbers accurate and forward-looking.
Operational efficiency metrics tell you how well your organization converts inputs, time, labor, capital, and energy, into finished output, revenue, and satisfied customers. Track them well, and you gain a factual view of where money leaks, where capacity sits idle, and where a small process change compounds into a large margin gain. Track them poorly, and you steer on guesswork. The sections below cover what these metrics are, which ones matter most, how to calculate them, and how modern data systems turn scattered numbers into a single, trustworthy source of decisions.
What Are Operational Efficiency Metrics?
Operational efficiency metrics are numerical indicators that express output as a ratio of the resources used to create it. A lower cost per unit, a shorter cycle time, or a higher machine utilization rate all point to the same idea: more value from the same or fewer inputs.
Two terms often get blurred, and the difference matters for how you act on the data:
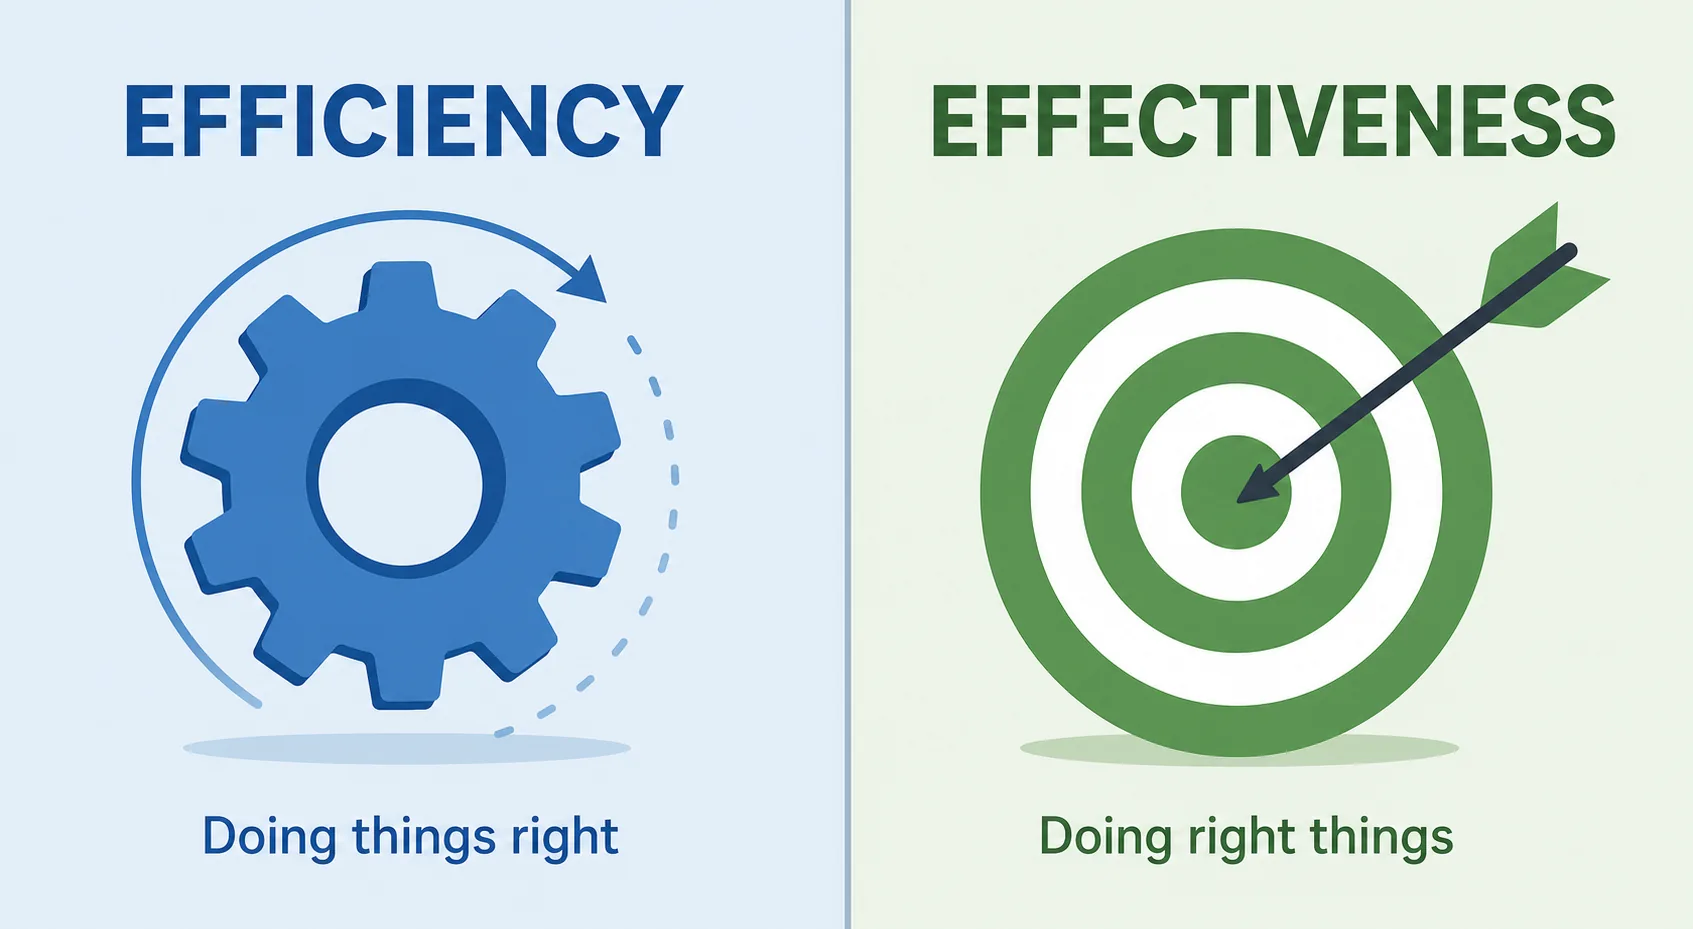
- Efficiency is about doing things right, the resource ratio. It asks whether you produced output with minimal waste.
- Effectiveness is about doing the right things, the outcome. It asks whether the output met the goal, such as on-time delivery or customer retention.
A factory can run at 95% machine utilization (highly efficient) while it builds products nobody ordered (ineffective). Strong operations balance both.
Efficiency vs. Effectiveness vs. Productivity
| Term | Core question | Example measure |
|---|---|---|
| Efficiency | Are we minimizing waste? | Cost per unit, cycle time |
| Effectiveness | Are we hitting the goal? | On-time delivery, retention |
| Productivity | How much output per input? | Units per labor hour |
Productivity is the raw output-per-input figure; efficiency judges that ratio against waste; effectiveness judges whether the result served the objective.
Why Operational Efficiency Metrics Matter for Enterprise Goals
Metrics connect daily operations to the numbers that define enterprise success. Four links stand out.
Margin protection. Every hour of idle equipment or reworked defect erodes profit. Efficiency data exposes those costs before they reach the income statement.
Growth without proportional cost. Scale becomes affordable when output rises faster than spend. The U.S. Bureau of Labor Statistics tracks labor productivity as output per hour worked, the ratio that lets a firm absorb rising demand without a matching rise in cost.
Data-driven decisions. A shared metric set replaces opinion with evidence, so leaders debate targets rather than facts.
Governance visibility. Consistent measurement supports data governance and audit readiness, since every figure traces back to a defined source and owner.
The 4 Types of Performance Metrics

Operations leaders often ask how to organize the dozens of numbers a business could track. Most frameworks group performance metrics into four types:
- Productivity metrics, output per unit of input, such as units per labor hour.
- Efficiency metrics, resource use relative to output, such as cost per unit or cycle time.
- Quality metrics, how well output meets standards, such as first-pass yield or defect rate.
- Utilization metrics, how fully a resource is used, such as capacity or equipment utilization.
Slot every metric you track into one of these four buckets. The framework prevents blind spots and stops teams from over-weighting a single category.
Core Operational Efficiency Metrics to Track (With Formulas)
The list below is the working core. For each metric you get a plain definition, the formula, and the direction that signals improvement. Two of these, capacity utilization and Overall Equipment Effectiveness, are the headline KPIs most often cited when someone asks which single number best captures operational efficiency.
| Metric | What it measures | Formula | Why it matters |
|---|---|---|---|
| Resource / capacity utilization | Share of available capacity actually used | Actual output ÷ maximum possible output × 100 | Idle capacity is paid-for waste |
| Process cycle time | Time to complete one full process | End time − start time | Shorter cycles free cash and capacity |
| Throughput | Units produced per period | Units ÷ time period | Direct measure of flow |
| Overall Equipment Effectiveness (OEE) | Availability × performance × quality | A × P × Q × 100 | Single view of asset health |
| On-time delivery rate | Orders delivered by promise date | On-time orders ÷ total orders × 100 | Reliability and customer trust |
| First-pass yield | Units correct without rework | Good units ÷ total units × 100 | Quality and rework cost |
| Operating expense ratio | Cost relative to revenue | Operating expenses ÷ revenue × 100 | Cost discipline at scale |
| Revenue per employee | Labor productivity | Revenue ÷ headcount | Human-capital efficiency |
| Customer retention rate | Efficiency of retention spend | Retained customers ÷ starting customers × 100 | Cheaper than acquisition |
| Energy per unit | Sustainability and cost | Energy used ÷ units produced | Cost and emissions control |
| Inventory turnover | How fast stock converts to sales | COGS ÷ average inventory | Working-capital health |
The headline efficiency KPI: for asset-heavy operations, OEE and capacity utilization answer both “which KPI measures operational efficiency?” and “what are the KPIs for operational effectiveness?” OEE folds availability, speed, and quality into one figure that a plant or process owner can defend.
1. Operating Efficiency Ratio Shows how much of your revenue is used to cover operating expenses. Formula: Operating Expenses / Revenue 2.
Operational Efficiency Metrics Examples by Function
Different departments track different slices of the same idea. These operational efficiency metrics examples show how the core set maps to real teams:
- Manufacturing: OEE, machine downtime, first-pass yield, energy per unit.
- Supply chain / logistics: on-time delivery, inventory turnover, order accuracy.
- IT / operations: system uptime, mean time to resolution, cost per ticket.
- Customer service: first-contact resolution, average handle time, retention rate.
- Finance: operating expense ratio, revenue per employee, days sales outstanding.
For manufacturing measures like OEE and defect rate, the NIST Manufacturing Extension Partnership offers neutral guidance to help small and mid-sized producers standardize these definitions before they compare results across sites.
How to Calculate and Benchmark Your Metrics
Raw numbers become operational efficiency metrics you can act on only when everyone calculates them the same way. Four steps keep the math honest.
- Define numerator and denominator once. Decide whether “capacity” means scheduled hours or calendar hours, then hold that definition across every plant and period.
- Set a baseline. Capture three to six months of history so you know what “normal” looks like before you chase a target.
- Choose a benchmark. Compare against your own trend first; add an industry reference where a credible one exists.
- Set target thresholds. Attach a green/amber/red band to each metric so a glance tells the story.
Watch for three pitfalls: inconsistent data sources, siloed systems that report the same figure two ways, and vanity metrics that look good but drive no decision. Many of these problems trace back to legacy, on-premise databases that never share a common definition, the exact gap that data modernization and connected cloud services close.
Free Operational Efficiency Metrics Template (What to Include)
You do not need specialist software to start. A practical operational efficiency metrics template is a single scorecard with one row per metric and these columns:
| Column | Purpose |
|---|---|
| Metric name | What you track |
| Formula | Exact calculation |
| Data source | Where the number comes from |
| Owner | Who is accountable |
| Baseline | Historical starting point |
| Target | The goal value |
| Current | This period’s result |
| Trend | Direction vs. last period |
| Review cadence | How often it is checked |
Replicate this structure in a spreadsheet or a BI dashboard. The owner and data-source columns are what most teams skip, and they are exactly what turns a number into an action.
Where AI and Forecasting Turn Metrics Into Foresight
Traditional metrics are lagging indicators: they report what already happened. The frontier for operations teams is the shift to leading indicators, where AI powered demand forecasting tools project what is likely to happen next and flag anomalies before they cost money.
How does AI predict trends? AI models learn patterns from historical results plus real-time signals, orders, sensor readings, weather, market data, then project demand and surface deviations a static report would miss. This is the core of AI forecasting: it converts a wall of past figures into a probable forward view.
Applied to operations, AI for forecasting sharpens the same operational efficiency metrics you already track. Predictive maintenance models cut machine downtime by flagging failures early; demand forecasting AI smooths inventory turnover and lifts on-time delivery by matching supply to real demand. The NIST AI Risk Management Framework offers a neutral reference for adopting these models responsibly, so forecast accuracy gains do not come at the cost of governance or explainability.
Two prerequisites decide whether artificial intelligence forecasting delivers: AI/ML readiness (clean, connected, labeled data) and strong data governance. Without them, even the best model amplifies bad inputs.
AI Forecasting Tools and Real-Time Data
The strongest AI forecasting tools feed on streaming data rather than monthly extracts. AI-driven event forecasting with real-time data pairs live signals with predictive models, so an efficiency dashboard updates as conditions change, a demand spike, a supplier delay, a temperature swing, instead of days later. That immediacy is what moves a metric from a report card into a control system.
Bringing Metrics Together with Enterprise Performance Management
Scattered operational efficiency metrics in separate spreadsheets rarely change behavior. Enterprise performance management (EPM) and business intelligence platforms consolidate them into one source of truth, with analytics automation, API connectivity, and legacy system modernization doing the plumbing underneath.
When you evaluate EPM software, weigh three criteria the market tends to reward:
- Integrations. The best enterprise performance management software integrations pull from your POS, ERP, and cloud data sources without brittle manual exports.
- Scalability. As you add sites, products, and users, the platform should extend metric coverage without a rebuild, the difference between best enterprise performance management software scalability and a tool you outgrow.
- Implementation. A sound implementation defines owners, data sources, and governance up front, so adoption sticks.
From a data architecture perspective, the recurring failure is not the metric, it is the disconnected data beneath it. This is where an experienced partner earns its place. Corpim (Corporate InfoManagement) is a digital transformation firm that helps organizations move from siloed on-premise databases to connected cloud services, giving cross-company transparency across existing POS and ERP systems. Sound data governance, a discipline reflected in the NIST Privacy Framework, keeps that consolidated view trustworthy as it scales.
Common Mistakes That Undermine Operational Efficiency Metrics
Even good metrics fail when the practice around them is weak. The usual culprits:
- Too many metrics. A scorecard with 40 numbers hides the five that matter.
- No owner. A metric nobody owns is a metric nobody improves.
- Stale or manual data. Numbers keyed in by hand once a month cannot drive real decisions.
- Efficiency mistaken for effectiveness. A perfectly efficient process that builds the wrong thing still loses.
- Local optimization. Squeeze one metric, say, machine speed, and you may wreck another, like quality yield. Optimize the whole system, not a single dial.
Frequently asked questions
Which KPI measures operational efficiency?
What are the 4 types of performance metrics?
What are examples of efficiency metrics?
What are the KPIs for operational effectiveness?
How do AI forecasting tools improve operational efficiency?
The Takeaway
Operational efficiency metrics create value only when they are defined consistently, owned by a named person, benchmarked against a real baseline, and fed by clean, connected, real-time data. The formulas are the easy part; the discipline and the data pipeline behind them separate a dashboard that decorates a wall from one that moves the business. As AI forecasting and EPM platforms mature, the organizations that win will be the ones whose metrics look forward, not just back, and that starts with modern, well-governed data and, often, an experienced digital transformation team to build it.