Ever wonder if there’s a real difference between business intelligence vs data analytics? Many business leaders use these terms mixed up, but they actually do very different things.
Both work with your company’s data. Both help you make smarter, faster decisions. But BI and data analytics serve different purposes, use different tools, and ask different questions.
In this guide, we’ll break it all down. You’ll learn when to use each one, how to build the right team, and what kind of tech delivers the best results for your business.
Business Intelligence: The Operational Foundation
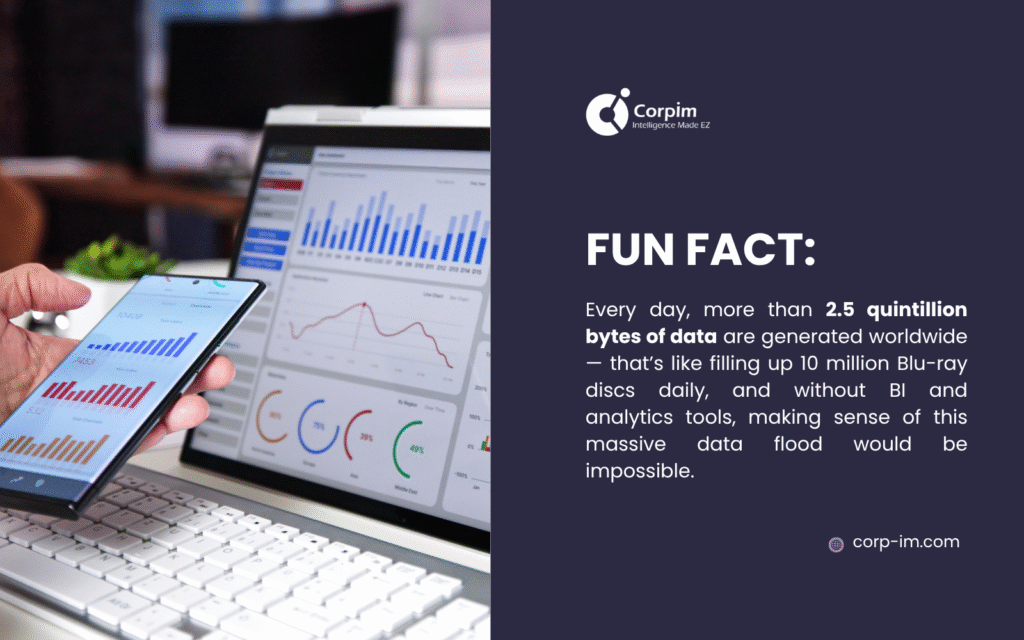
Business intelligence transforms raw data into actionable insights through structured reporting and visualization.
Modern business intelligence systems excel at monitoring key performance indicators, tracking operational metrics, and providing historical context for business decisions. These platforms collect information from multiple sources as ERP systems, CRM databases, and financial applications.
Modern BI solutions prioritize user accessibility over technical complexity.
Modern BI solutions focus on ease of use over technical complexity. You as a business manager can create custom reports without any code and executives get real-time dashboards that display key business metrics.
When more people can access data easily, your company makes decisions faster at every level.
For companies that want complete solutions, business intelligence reporting offers clear frameworks for regular stakeholder updates. Business intelligence works best because it stays consistent and reliable.
BI reports follow standardized formats that make month-over-month comparisons straightforward. Automated data pipelines make sure that information is accurate while reducing manual processing errors.
Many organizations are relying on BI for regulatory compliance, financial reporting, and operational monitoring.
Key Business Intelligence Capabilities
| Capability | Primary Function | Business Impact | User Type |
| Data Visualization | Charts, graphs, interactive dashboards | Faster insight recognition | Business managers |
| Self-Service Reporting | Drag-and-drop report creation | Reduced IT dependency | Department heads |
| Real-Time Monitoring | Live data feeds and alerts | Immediate issue detection | Operations teams |
| Automated Reporting | Scheduled report distribution | Consistent stakeholder updates | Executives |
| Performance Dashboards | KPI tracking and trend analysis | Strategic decision support | C-suite leaders |
Data Analytics: The Strategic Innovation Engine
Data analytics uses many different methods to find insights in both organized and messy data. Analytics experts use statistics, machine learning, and math models to spot patterns and predict what comes next.
The process starts with data discovery. Teams find useful datasets inside the company and from outside sources. They clean up this data with special tools and code.
Next comes statistical analysis. Professionals test ideas and find connections between different data points. This helps them understand what the numbers really mean.
Machine learning models are the most advanced part of data analytics. These computer programs can spot complex patterns in huge amounts of data. They make predictions about future events and suggest what actions to take.
Advanced analytics teams use these models to predict customer behavior, assess risks, and improve operations. Companies that want better analytical capabilities should explore how AI in business intelligence can automate insight creation and improve decision accuracy.
Analytics Methodologies and Applications
| Analytics Type | Purpose | Techniques Used | Business Applications |
| Descriptive Analytics | Summarize historical data | Statistical summaries, trend analysis | Customer segmentation, sales reports |
| Diagnostic Analytics | Explain why events occurred | Root cause analysis, correlation studies | Performance troubleshooting, anomaly detection |
| Predictive Analytics | Forecast future outcomes | Machine learning, regression models | Demand forecasting, risk assessment |
| Prescriptive Analytics | Recommend specific actions | Optimization algorithms, simulation | Resource allocation, pricing strategies |
Technology Infrastructure: Platform Requirements and Architecture
The technology requirements for business intelligence vs data analytics differ significantly in scope and complexity. BI platforms prioritize ease of use and standardized reporting capabilities.
These systems typically connect to structured data sources through pre-built connectors and ETL processes.
Data warehouses are the backbone of most business intelligence (BI) systems. They store organized and cleaned data, and make it easier to create reports and analyze information.
Today, cloud-based data warehouses are popular because they are faster and easier to scale than older, on-site systems.
Analytics platforms require more flexible and powerful infrastructure. Data lakes accommodate diverse data types, including unstructured text, images, and streaming data.

Advanced data analysis needs a lot of computer power, especially for training models and running detailed calculations. If your organization is setting up its systems, check out our complete cloud computing guide to help choose the right platform.
Cloud Computing Platform Comparison
| Platform Type | Best For | Advantages | Considerations |
| Public Cloud | Scalable BI workloads | Cost-effective, unlimited scalability | Data sovereignty concerns |
| Private Cloud | Sensitive data analytics | Maximum security control | Higher operational costs |
| Hybrid Cloud | Mixed workload requirements | Flexibility with security | Complex integration management |
| Multi-Cloud | Vendor diversification | Avoid lock-in, best-of-breed | Increased complexity |
Integration Challenges and Solutions
Data integration represents a common challenge across both BI and analytics implementations. Organizations must connect disparate systems, standardize data formats, and maintain data quality standards.
Modern integration platforms offer pre-built connectors and automated data transformation capabilities.
API-based integration approaches provide flexibility for connecting cloud and on-premise systems. RESTful APIs enable real-time data synchronization while maintaining system independence.
Master data management becomes critical as organizations scale their data initiatives. MDM systems ensure consistent data definitions across business units. These capabilities prove essential for regulatory compliance and analytical accuracy.
Organizational Impact: Teams, Skills, and Culture
Team Structure and Skill Requirements
| Role Category | BI Team Requirements | Analytics Team Requirements | Key Responsibilities |
| Technical Skills | SQL, ETL tools, BI platforms | Python/R, statistics, ML frameworks | Data processing and model development |
| Business Acumen | Domain knowledge, process understanding | Industry expertise, strategic thinking | Translate requirements to solutions |
| Communication | Report writing, presentation skills | Data storytelling, visualization | Present insights to stakeholders |
| Time Investment | 3-6 months training | 12-24 months development | Skill acquisition timeline |
| Team Size | 3-5 professionals | 5-10 specialists | Typical team composition |
Building Effective Data Teams
Strong data teams blend technical skills with business knowledge. Cross-functional collaboration between domain experts and data professionals produces more useful results. Regular contact with business stakeholders keeps projects connected to real needs.
Staff development helps employees adapt to data-driven work. Business users need data literacy, while technical staff benefit when they learn about the business. A culture of continuous education drives both innovation and adoption.
Companies face stiff competition when they hire skilled data professionals. Organizations can also invest in current staff development or partner with universities to build future talent.

Implementation Strategies: Choosing the Right Approach
The choice between business intelligence and data analytics depends on specific business requirements, organizational maturity, and strategic objectives. Organizations with well-defined reports and stable data sources often benefit from BI-first approaches.
Companies that seek competitive differentiation through innovation typically prioritize analytics capabilities.
Maturity assessment helps determine the appropriate start point for data initiatives. Organizations with limited data infrastructure should establish basic BI capabilities before they pursue advanced analytics.
Resource constraints influence implementation strategies. BI projects typically require less specialized talent and shorter timelines. Analytics initiatives demand greater investment in skills development and infrastructure but offer higher potential returns through predictive capabilities.
Small to medium enterprises often benefit from foundational approaches—knowledge of business intelligence for small businesses helps establish realistic expectations and implementation roadmaps.
Implementation Timeline and Resource Requirements
| Project Phase | BI Implementation | Analytics Implementation | Success Factors |
| Planning & Design | 2-4 weeks | 4-8 weeks | Clear requirements definition |
| Data Preparation | 4-6 weeks | 8-12 weeks | Data quality assessment |
| Development | 6-12 weeks | 12-24 weeks | Iterative development approach |
| Testing & Validation | 2-4 weeks | 4-8 weeks | User acceptance criteria |
| Deployment | 1-2 weeks | 2-4 weeks | Change management support |
| Total Timeline | 3-6 months | 8-14 months | Executive sponsorship |
Industry-Specific Applications
| Industry | BI Applications | Analytics Applications | Key Metrics |
| Financial Services | Regulatory reporting, risk dashboards | Fraud detection, credit scoring | ROI, risk ratios |
| Healthcare | Patient care metrics, compliance reports | Population health, treatment optimization | Patient outcomes, cost reduction |
| Manufacturing | Production monitoring, quality control | Predictive maintenance, demand forecasting | OEE, downtime reduction |
| Retail | Sales reporting, inventory management | Customer behavior, pricing optimization | Conversion rates, margin improvement |
| Automotive | Service performance, parts inventory | Warranty analysis, customer retention | Service efficiency, customer satisfaction |
Retail and E-commerce Applications
Retail organizations blend BI and analytics capabilities effectively. Daily sales reports, inventory management, and customer service metrics require reliable BI systems. These operational reports inform day-to-day business decisions and identify immediate issues.
Customer analytics drives strategic initiatives in retail environments. Purchase behavior analysis, recommendation systems, and personalized campaigns rely on advanced analytics techniques.
Machine models predict customer lifetime value, churn probability, and product preferences.
Supply chain optimization benefits from both BI and analytics approaches.
Real-time inventory data through BI systems combines with demand forecasts to optimize purchase and distribution decisions.
ROI Analysis and Business Value Measurement
ROI Analysis Framework
| ROI Component | BI Benefits | Analytics Benefits | Measurement Method |
| Cost Reduction | Report automation, reduced manual work | Process optimization, waste reduction | Time savings × hourly rates |
| Revenue Growth | Faster decision-making, market visibility | Customer insights, pricing optimization | Revenue attribution analysis |
| Risk Mitigation | Compliance monitoring, operational alerts | Predictive risk models, early warning | Avoided loss calculations |
| Efficiency Gains | Self-service capabilities, streamlined processes | Automated recommendations, resource optimization | Productivity metrics |
| Typical ROI Range | 150-300% | 200-500% | 3-year measurement period |
Value Measurement Frameworks
Balanced scorecard approaches help organizations track both financial and operational metrics related to data initiatives.
Financial measures include direct cost savings and revenue improvements. Operational metrics track data quality, user adoption, and decision-making speed.
Business case development should include both quantitative and qualitative benefits. While cost savings and revenue improvements provide clear ROI calculations, competitive advantages and risk mitigation offer strategic value that may be harder to quantify but equally important.
Regular value assessment ensures data programs remain aligned with business objectives. Quarterly reviews of key performance indicators help identify successful initiatives and areas requiring improvement.
This ongoing evaluation supports program optimization and resource allocation decisions.
Advanced Integration: Building Unified Data Strategies
Modern organizations increasingly recognize that business intelligence vs data analytics represents a false choice. Successful companies integrate both capabilities into unified data strategies that support operational excellence and strategic innovation.
Integrated platforms combine BI reporting capabilities with advanced analytics features. Users can drill down from executive dashboards into detailed analytical models, which creates seamless workflows between operational monitoring and strategic analysis.
Business intelligence strategy development must consider both current operational needs and future analytical aspirations. Organizations benefit from architectural planning that accommodates both structured reporting requirements and flexible analytics workloads.
Technology Convergence Trends
Cloud-native platforms increasingly offer both BI and analytics capabilities through unified interfaces. These solutions reduce integration complexity while providing scalable infrastructure for diverse workloads.
Organizations can start with basic reporting and expand into advanced analytics without platform migration.
Artificial intelligence enhances both BI and analytics capabilities through automated insight generation and natural language interfaces.
AI-powered BI tools can identify anomalies and suggest explanations for performance changes. Analytics platforms use AI to automate model selection and feature engineering processes.
The emergence of augmented analytics democratizes advanced capabilities across business users. Natural language query interfaces allow managers to ask complex questions without technical expertise.
Automated insight generation highlights important patterns that might otherwise go unnoticed.
Future Trends and Emerging Technologies
Business Intelligence vs Data Analytics are getting closer as new tech grows and business needs change. Tools today mix reporting, predictions, and insights in ways we didn’t see before.
Real-time analytics helps teams see what’s happening now, not just what happened before. With stream processing, data flows non-stop, and teams can act right away.
Edge computing brings data tools closer to where the data starts. Machines in factories, retail shops, or phones can read and use data on the spot. They also send that data to a main system for bigger analysis.
Explainable AI helps people understand how a model works. This is important for staying within the rules and being fair.
Simple, clear models build trust and help connect complex data with real business goals.
Making the Strategic Choice: Implementation Recommendations
Organizations evaluating business intelligence vs data analytics should consider their current capabilities, business objectives, and resource constraints.
Companies with immediate operational reporting needs should prioritize BI implementations while planning for future analytics capabilities.
Business intelligence for small businesses offers accessible entry points for organizations with limited resources. Cloud-based BI platforms provide enterprise capabilities without significant infrastructure investments. These solutions can grow with organizational needs while building data literacy and analytical culture.
The most successful data programs combine operational excellence through business intelligence with strategic innovation through advanced analytics.
If your organization masters this integration, you will achieve competitive advantages through superior decision-making capabilities and market responsiveness.
For nearly 30 years, Corpim has been the trusted leader in digital transformation and data modernization services.
From Fortune 500 companies to growing startups across automotive, financial services, healthcare, and manufacturing industries, we deliver cloud computing solutions, enterprise performance management, and industry-specific SaaS products that drive real results.
Our certified professionals simplify complex business processes with modern DataTech services and scalable cloud solutions tailored to your needs.
Join thousands of satisfied clients who trust Corpim to modernize their IT infrastructure and leverage data for competitive advantage. Contact us today to discover how our integrated BI and analytics solutions can transform your business.


